
A guide to understanding your iSolarcloud app
A guide to understanding your iSolarcloud app
Discover the iSolarCloud app, Sungrow’s dedicated platform designed to empower Australian homeowners and businesses with seamless monitoring of their solar installations. Through this app, users can gain real-time insights into their electricity generation, consumption, and potential savings. If you’re a Sungrow solar system owner and haven’t tapped into this resource yet, you can easily download the iSolarCloud app from your device’s app store using the links here.
For a downloadable/printable version of this guide, click here.
1. Initial Log In and Status
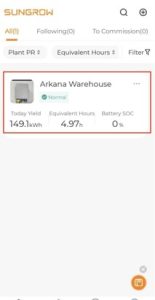
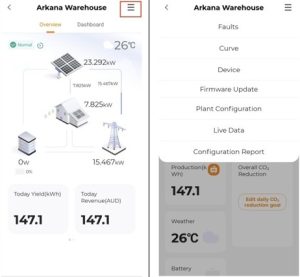
- After logging into the app, you’ll see your plant name and a snapshot overview.
- If the status displays “Normal,” this means your system is functioning as expected.
- To navigate further, simply click on your plant name.
2. The Overview Tab
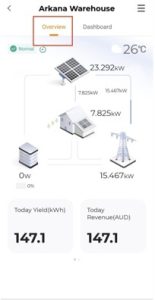
- The Overview tab provides details on the current status of your inverter:
- Solar Panels: Displays the electricity currently generated by your solar panels.
- House Icon: Shows the amount of electricity you are consuming.
- Pylon Icon: Illustrates the electricity being sold to or purchased from the grid.
- Yield Today: Indicates how much solar energy you’ve produced for the day.
- Revenue: Additional details on this can be found further down this page.
3. The Dashboard Tab
- Clicking on the “Dashboard” tab will show the historical data starting with the graph of your solar production over the period of the day.
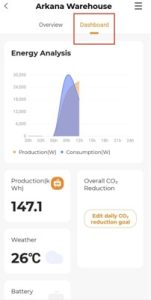
- For a deeper dive into your data:
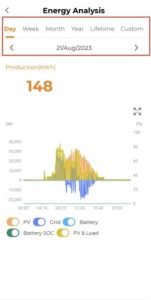
- Click on the graph to access historical data, spanning from previous days to months or even years.
- At the top, you’ll find options for Day, Week, Month, Year, Lifetime, and Custom.
- At the bottom are toggle switches to customise the display information.
- Note: Without a consumption monitor installed, only the PV generation field will be visible.
4. Accessing Additional Options
- Click the menu field in the top right corner for more features.
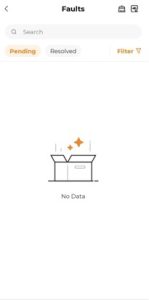
5. Monitoring System Faults
- The Faults tab lists any system issues.
- Pending: means there is an active fault.
- Resolved: Faults that occurred but have since been addressed.
Common faults, like a neighbourhood power outage, often resolve on their own once power is restored.
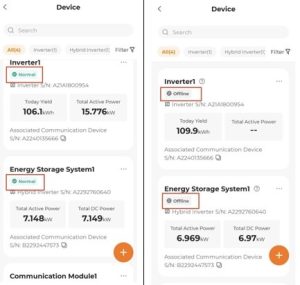
6. The Device Tab
- The Device tab gives insights into the status of your system.
- Normal status confirms the system’s correct operation.
- Offline usually suggests a loss of WiFi connection or that the inverter is turned off.
- Here you can view the performance of multiple devices if you have more than one.
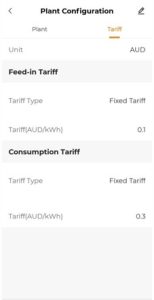
7. Setting Up Plant Configuration
- Here, you can set up the Tariffs (rates) you’re charged or credited by your electricity company. This information helps in calculating your system’s savings.
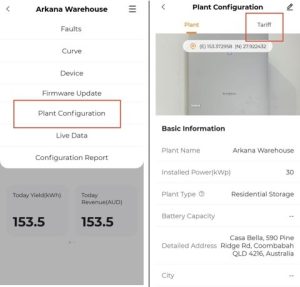
- To adjust your tariff rates:
- Click the pencil icon in the top right of the Tariff tab.
- Feed in Tariff: is the rate you receive for electricity you sell back to the grid. Often referred to as Solar Buyback, Solar Feed In, or Solar Export.
- Consumption Tariff: is the rate you’re charged for electricity from the grid.
In this example the “feed in tariff” rate for Solar exported back to the grid is 10c/kWh and the “consumption tariff” being charged for using electricity from the grid is
8. Understanding Total Revenue Savings
- The savings shown in the Revenue section of iSolarcloud might not match your power bill.
- Your bill reflects only the credit for the total solar exported (Feed in Tariff).
- The app’s Revenue section combines credits from grid exports with savings from using your solar-generated electricity. Remember, the electricity you generate and use doesn’t appear on your bill.
We hope this guide enhances your iSolarCloud app experience. Should you have further queries, please see Sungrows dedicated page here.